How I spent my time in 2021

Each year, I do an audit of how I spent my time in order to look for areas of improvement. I used to do this manually, but this year I decided to write a python script for it. Here's a short outline of how I spent my time this year.
I had 1397 meetings in 2021, and spent a total of 1067 hours in meetings. (I define a meeting as a zoom, call, walk, in-person, etc.). Assuming 50 weeks at 8 hours day, this means I spent 53% of my time in meetings.
In terms of what type of meetings I had - this is what my chart looks like:
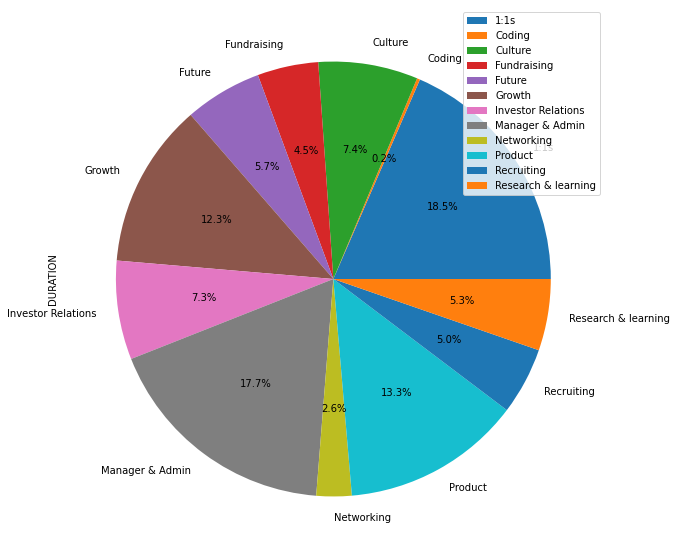
Pretty nicely distributed, but some areas to improve:
- I spent way too much time in 1:1s (almost 20% of my time), and way too much time on Manager & Admin (this is stuff like email, finance, fires, etc.).
- I didn't spend enough time recruiting, and not enough time on growth & product.
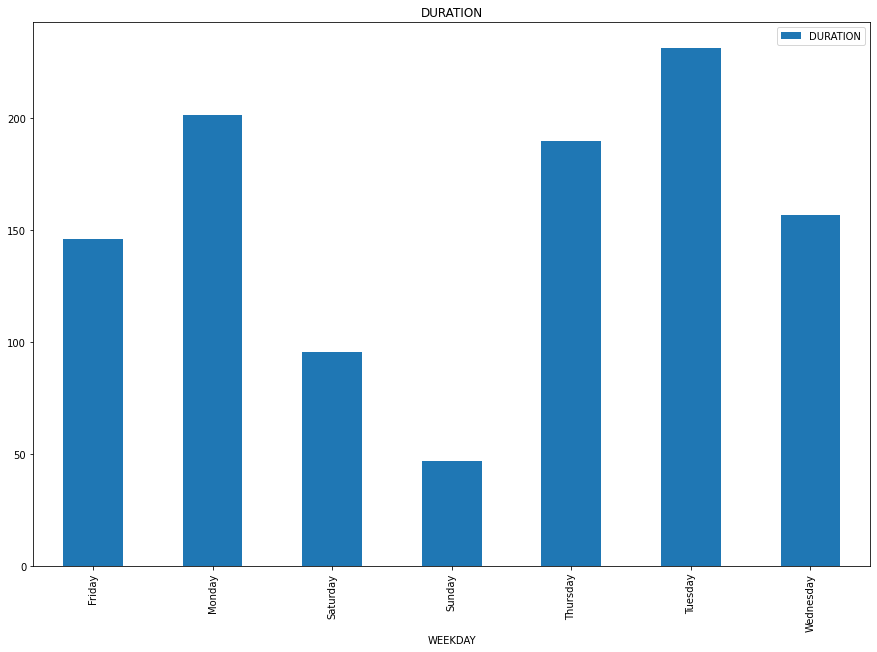
In terms day-of-the-week, it seems I have most of my meetings Mon, Tue, Thurs. Nothing super actionable here, but fun to know.
So what are my biggest learnings and what do I plan to change in 2022? Based on this data, a few things:
- Spend less time in meetings overall: my goal is to bring time-in-meetings down from 53% to 40%
- Bring 1:1 time from 18.5% to 10%. 1:1s are great and I enjoy them, but this data shows that I likely have too many direct reports (10), so I have to cut back.
- In terms of what I plan to spend more time on: as we scale Ezra, my job as CEO needs to shift more into building team and instilling culture. So I plan to increase the time I spend on recruiting, and on culture.
Overall, here's how I'd like my time to look like at the end of 2022:
Growth / product / future - 50%
- Growth (marketing / sales / PR / etc.) 20%
- Product (wireframes / writing / design) 15%
- Future (planning / OKRs / presentations / advisors) 10%
- Research (coding / reading / writing) 5%
Hiring & managing - 35%
- 1:1s with my team 10%
- Recruiting 10%
- Culture 10%
- Manager & Admin (email / prep / etc.) 5%
Investors / networking - 15%
- Investor Relations 10%
- Networking 5%
If you'd like to do this analysis yourself, I’ve written a small python script that imports a .csv of your Google Calendar and outputs metrics and graphs. It requires a bit of data cleaning & tagging (took me about 3-4 hours), but it's totally worth it. You can find the script here.